> > Organ Donors and Transplant Recipients > > Quarterly Performance Scorecard > > Leading Practice & Global Comparison > > How is organ donation measured? Globally organ donation rates are measured in Donors Per Million of Population (DPMP) as this takes into account changes in population over time. In 2021, USA achieved 41.6 DPMP and Spain 40.2 while Australia only achieved 16.4 DPMP. In 2008, the government provided the funding “to establish Australia as a world leader in organ donation for transplantation”. After 13 years and about $600M injection of funds, Australia is still performing well below 50% of world leading practice. Over the 10 years there has only been a growth of 9.5 DPMP. As implementation of the Reform Package was slow and ineffective, 6,637 people missed out on receiving a transplant between 2009 and 2019. One organ donor may be able to save the lives of many recipients as multiple organs can be donated to several people. Targeted Number of Transplants over the years are obtained from the “Reform Package” Budget presented to Cabinet in 2008. 2013 to 2019 are based on 90 transplant recipients per million population.AUSTRALIAN ORGAN DONATION PERFORMANCE
AUSTRALIAN ORGAN DONORS & TRANSPLANT RECIPIENTS
ORGAN DONORS PER MILLION OF POPULATION
Year
Actual Number
of DonorsMid-Year
Populations
(Millions)Donors Per
Million Population
(DPMP)
2008
259
21.4
12.1
2009
247
21.7
11.4
2010
309
22.0
14.0
2011
337
22.3
15.1
2012
354
22.7
15.6
2013
391
23.1
16.9
2014
378
23.5
16.1
2015
435
23.8
18.3
2016
503
24.1
20.8
2017
510
24.6
20.7
2018
554
24.9
22.2
2019
548
25.3
21.6
ORGAN TRANSPLANT RECIPIENTS
Year
Actual Number of
Transplant RecipientsTargeted Number of
TransplantsNumber missed out on
receiving a transplant
(from 2009, cumulative)
2009
799
908
109
2010
931
1,155
333
2011
1,001
1,403
734
2012
1,052
1,650
1,332
2013
1,122
1,668
1,878
2014
1,117
1,885
2,646
2015
1,241
2,157
3,562
2016
1,448
2,169
4,283
2017
1,402
2,214
5,095
2018
1,544
2,253
5,804
2019
1,444
2,277
6,637
QUARTERLY SCORECARD
Since the formation of the Organ and Tissue Authority in January 2009, ShareLife Australia has used national organ registry data from ANZOD to produce a quarterly scorecard that tracks Australia’s performance in the global context. Just prior to the formation, for the 12 months ended December 2008, Australia procured 39.0 Transplant recipients per million population (pmp). Despite more than $45,000,000.00 annual support by the Federal Government, the number of Transplant recipients for the 12 months ended December 2021 has only increased to 45.6 pmp and a decline from the peak of 61.6 pmp in December 2018. To be a “world leader” we need to be doing nearly 90 Transplant recipients pmp.
Follow the links below to view each of the scorecard reports (PDF).
SCORECARDS 2021
SCORECARDS 2020
SCORECARDS 2019
SCORECARDS 2018
December 2018
September 2018
June 2018
March 2018
SCORECARDS 2017
December 2017
September 2017
June 2017
March 2017
SCORECARDS 2016
December 2016
September 2016
June 2016
March 2016
SCORECARDS 2015
December 2015
September 2015
June 2015
March 2015
SCORECARDS 2014
December 2014
September 2014
June 2014
FIRST SCORECARD
STATE PERFORMANCE
The distribution of population by State in Australia varies widely. The chart below shows that the number of donors per million population are not consistent across States and Territories. Vic has consistently performed above the national rate over the last few years while NSW has continued to perform below the national rate. Qld has moved from below to above the national rate in the previous 2 years but last year declined substantially. The smaller States and Territories also tend to experience larger variations in donors per million population measures year on year.
In 2018, were it not for the substantial increase in Vic, there would have been no increase in the national rate.
Victoria now dominates the number of deceased donors. Given the size of population in NSW, VIC and QLD, improvements in these States from a donors per million population perspective will have a substantial impact on the number of donors in Australia.
HOSPITAL PERFORMANCE
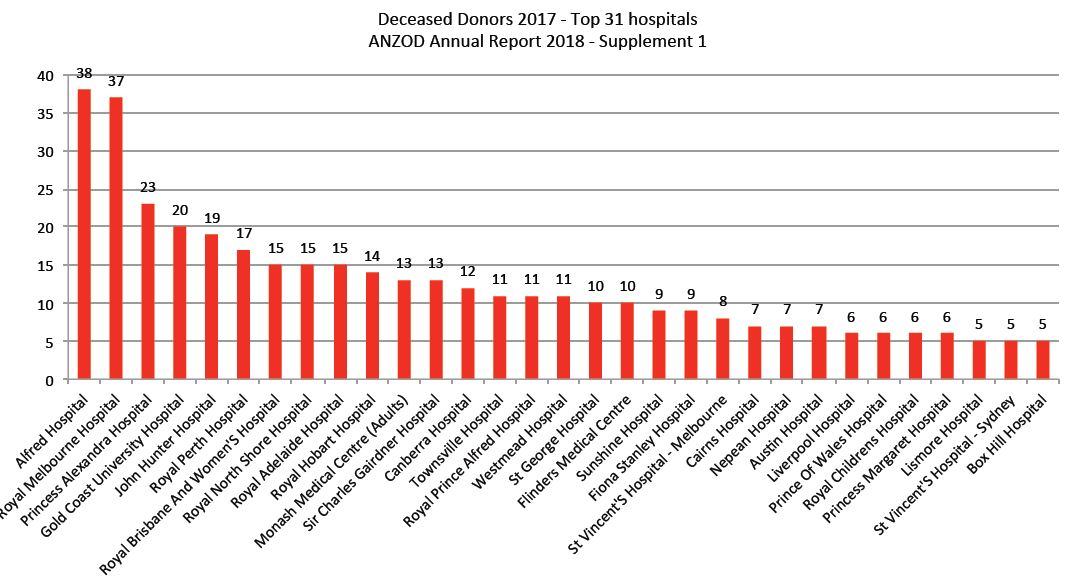
In 2017, 87 Donor hospitals in Australia procured 510 donors. The chart below shows the first 32 hospitals ranked by number of organ donors. Note the remaining 55 hospitals (not shown) had four or less donors.When ranking hospitals by the number of organ donors in 2017:
- The leading hospital had 38 donors
- 18 out of 87 hospitals (20%) had 10 or more donors (304, amounting to 60% of total donors)
- 14 out of 87 hospitals (16%) had between 5 and 9 donors (91 amounting to 18% of total donors)
- 55 out of 87 hospitals (64%) had 4 or less donors (115 amounting to 22% of total donors)
Comparing the annual average of the 7 years prior to that of the 9 years post establishment of OTA, of the top 31 hospitals in 2017, only 11 hospitals increased by more than 5 donors per annum with the size of the increase declining rapidly after these.
ShareLife is calling for more timely and transparent release of data in line with the Recommendations of the Ernst & Young Report
“Review of the implementation of the national reform agenda on organ and tissue donation and transplantation 2015”
.
LEADING PRACTICE & GLOBAL COMPARISON
See how Australian organ donation performance compares with the rest of the world and performance by leading practice in organ donation.
<


